


February EV Sales: A Look at the Trends
Last month’s electric vehicle (EV) sales data presents a mixed bag of trends, indicating both challenges and continued growth in the burgeoning EV market. While overall sales volume saw a slight dip, the month still marked a February record. Data from the EV Market Monitor, which tracks sales volume, days’ supply, and average pricing for new and used EVs, gives us a detailed view.
New EV Sales
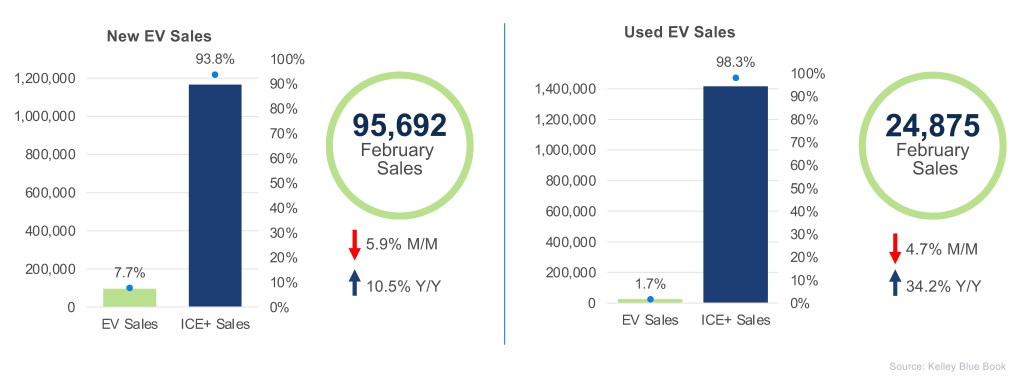
New EV sales saw a 5.9% decline month-over-month, with 95,692 units sold in February. Despite this decrease, it was the highest volume ever recorded for the month of February. Year-over-year, sales volume increased by 10.5%, but market share decreased to 7.7%.
Luxury brands enjoyed a strong performance. BMW and Rivian saw significant gains, with sales increases of 20.9% and 34.0% respectively, compared to the previous month. However, Tesla sales were down 10.0%, driven by drops in Cybertruck (-32.5%), Model 3 (-17.5%), and Model Y (-3.1%) sales.
The top five best-selling models by sales were the Tesla Model Y, Tesla Model 3, Ford Mustang Mach-E, Honda Prologue, and Rivian R1S.
Used EV Sales
Used EV sales decreased by 4.7% in February, with 24,875 units sold. Still, there was a substantial year-over-year growth of 34.2%. Tesla maintained its dominant position in the used EV market, holding a 39.9% sales share, despite a 9.2% decrease in month-over-month sales volume.
Inventory and Pricing Dynamics

New EV Days’ Supply
In February, the days’ supply for new EVs increased by 16.8% month-over-month, reaching 104 days. This surpassed internal combustion engine plus (ICE+) vehicles’ days’ supply after being lower the previous month. Year-over-year, new EV days’ supply decreased by 31.7%, indicating improved inventory turnover compared to the prior year.
Used EV Days’ Supply
The days’ supply of used EVs reached 49 days in February. This represents a 5.9% increase month-over-month, but a 21.5% decrease year-over-year. The gap between ICE+ and EV days’ supply narrowed to just one day. The lower days’ supply for EVs indicates a strong market.
Pricing Trends
New EV Average Transaction Price
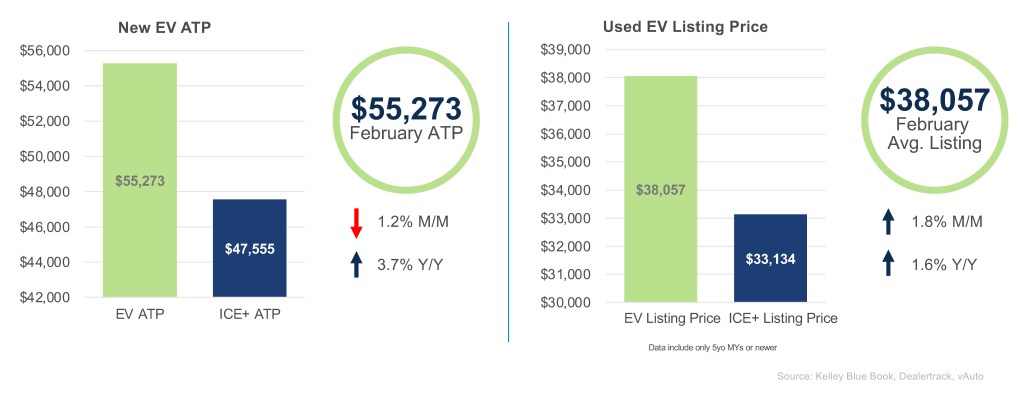
The average transaction price (ATP) for new EVs was $55,273 in February, reflecting a 1.2% decrease from the previous month, but a 3.7% increase year-over-year. The price premium for EVs was 16.2% on average. Incentive spending reached its highest level at 14.9% of ATP, which was 4.4% higher than the previous month.
Used EV Average Listing Price
The average listing price for used EVs was $38,057, an increase of 1.8% month-over-month and a 1.6% increase year-over-year. Twelve brands had listing prices below those of their ICE+ counterparts. Affordable options remain available, with 39% of units sold priced under $25,000.
The EV Market Monitor offers insights into the electric vehicle market by tracking crucial metrics, with data compared month-over-month and year-over-year. For more detailed information, consult the Q4 Electric Vehicle Report, the official quarterly publication for EV data.